Background
The Fear and Greed Index provided by the CNN site is a representative index that shows the sentiment of the stock market.

This index is calculated by aggregating MARKET MOMENTUM, STOCK PRICE STRENGTH, STOCK PRICE BREADTH, PUT AND CALL OPTIONS, MARKET VOLATILITY, SAFE HAVEN DEMAND, JUNK BOND DEMAND. In this post, I want to explain how to crawl the historical data of Fear-and-Greed Index and store it as a CSV file.

Prework
Crawling data from Interactive Chart
The way to get chart data on the web page was to refer to Medium Posting and found URL endpoints that provide chart data as JSON using Chrome Devtool.
Click on the link to see that the time series data you want is included in the "fear_and_greed_historical" key value of the JSON.
https://production.dataviz.cnn.io/index/fearandgreed/graphdata/2023-02-10
Isn't it too simple?
If I could fetched the JSON data in this simple way, I wouldn't have left a post.
The problem was that when I tried to get the above data with a programming code, not a browser, the request was blocked by the server policy.
The Headless Browser I posted in the past makes it easy to solve these problems and get data.

Let's Coding!
I have described the basic project setup method in the post above, so please refer to it and start with the basic code base as shown below.
const puppeteer = require("puppeteer");

const run = async () => {
  try {
    const browser = await puppeteer.launch({
      args: ["--no-sandbox"],
    });
    const page = await browser.newPage();

  } catch (e) {
    console.log(e);
  }
};

run();Now we can go to the page url we want to extract and select the appropriate selector to cut the data part neatly.
In this case, the selector value was selected as 'pre' because the targeted JSON data is well wrapped in the <pre></pre> tag.
const puppeteer = require("puppeteer");
const fs = require("fs");

const run = async () => {
  try {
    const browser = await puppeteer.launch({
      args: ["--no-sandbox"],
    });
    const page = await browser.newPage();
    await page.goto('https://production.dataviz.cnn.io/index/fearandgreed/graphdata');
    const selector = 'pre';
    await page.waitForSelector(selector);

    let data = await page.$eval(selector, (element) => element.textContent);
    let data_json = JSON.parse(data);

    console.log(data_json);
    browser.close();

  } catch (e) {
    console.log(e);
  }
};

run();When you run the script, you can see that JSON data is well taken.
node index.js(out){ (out) fear_and_greed: { (out) score: 70.1142857142857, (out) rating: 'greed', (out) timestamp: '2023-02-10T23:44:47+00:00', (out) previous_close: 72.1714285714286, (out) previous_1_week: 76.2571428571429, (out) previous_1_month: 51.8285714285714, (out) previous_1_year: 33.6 (out) }, (out) fear_and_greed_historical: { (out) timestamp: 1676072687000, (out) score: 70.1142857142857, (out) rating: 'greed', (out) data: [ (out) [Object], [Object], [Object], [Object], [Object], [Object], (out) ...
Transform Data
Now add the following data processing functions and complete the code that stores it in the form of a CSV file.
- Convert the TIMESTAMP value of Index to the format as 'yyyy-mm-dd'
- Convert the Array of Object data format to CSV String format
const puppeteer = require("puppeteer");
const fs = require("fs");

const run = async () => {
  try {
    const browser = await puppeteer.launch({
      args: ["--no-sandbox"],
    });
    const page = await browser.newPage();
    await page.goto('https://production.dataviz.cnn.io/index/fearandgreed/graphdata');
    const selector = 'pre';
    await page.waitForSelector(selector);

    let data = await page.$eval(selector, (element) => element.textContent);
    let data_json = JSON.parse(data);

    let data_array = data_json.fear_and_greed_historical.data

    browser.close();
    const csv_data = [
    [
      "datetime",
      "index_value",
      "rating"
    ],
    ...data_array.map(item => [
      timestamptodatestr(item.x),
      item.y,
      item.rating
    ])
  ]
   .map(e => e.join(","))
   .join("\n");

   console.log(csv_data);
   fs.appendFileSync("./index_data.csv", csv_data);
  } catch (e) {
    console.log(e);
  }
};

const timestamptodatestr = (ts) => {
    const d = new Date(ts);
    let datestr = d .toISOString().slice(0,10);
    return datestr;
}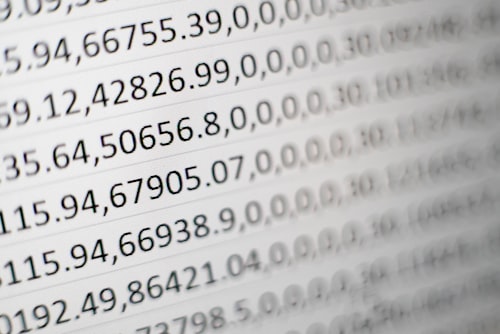
run();You can see that the data is well printed to the console window and stored as index_data.csv file!
Wrap-up
If the server blocks the request other than a browser, it seems to be a useful example of crawling data by using Headless Browser. (Note that excessive requests can be block from the server.)
The next post is to use the time series data extracted here to backtest simple strategy with this index in Google Spreadsheet ~ Thank you for reading! 😊